About me

Hi, I'm Laimis - based in London, and currently fidning myself professionally at the intersection of finance and data.

I started building this portfolio before I had any real-world experience, as a way to document my learning journey. Since then, some of those skills have made it into the workplace - such as Excel modelling, reporting, and Python for data processing and automation. Others, like SQL, NLP, and dashboards, remain in my toolbox waiting for their right time to shine. Feel free to explore the projects - the related code is shared here as well.

Portfolio projects

Below are some of the projects that helped me build my data skill set in a hands-on way. You will find some SQL and Python code as well as visualisations using Tableau and Excel.

Storytelling with Data

Excel | Word | Data Visualisation | Storytelling

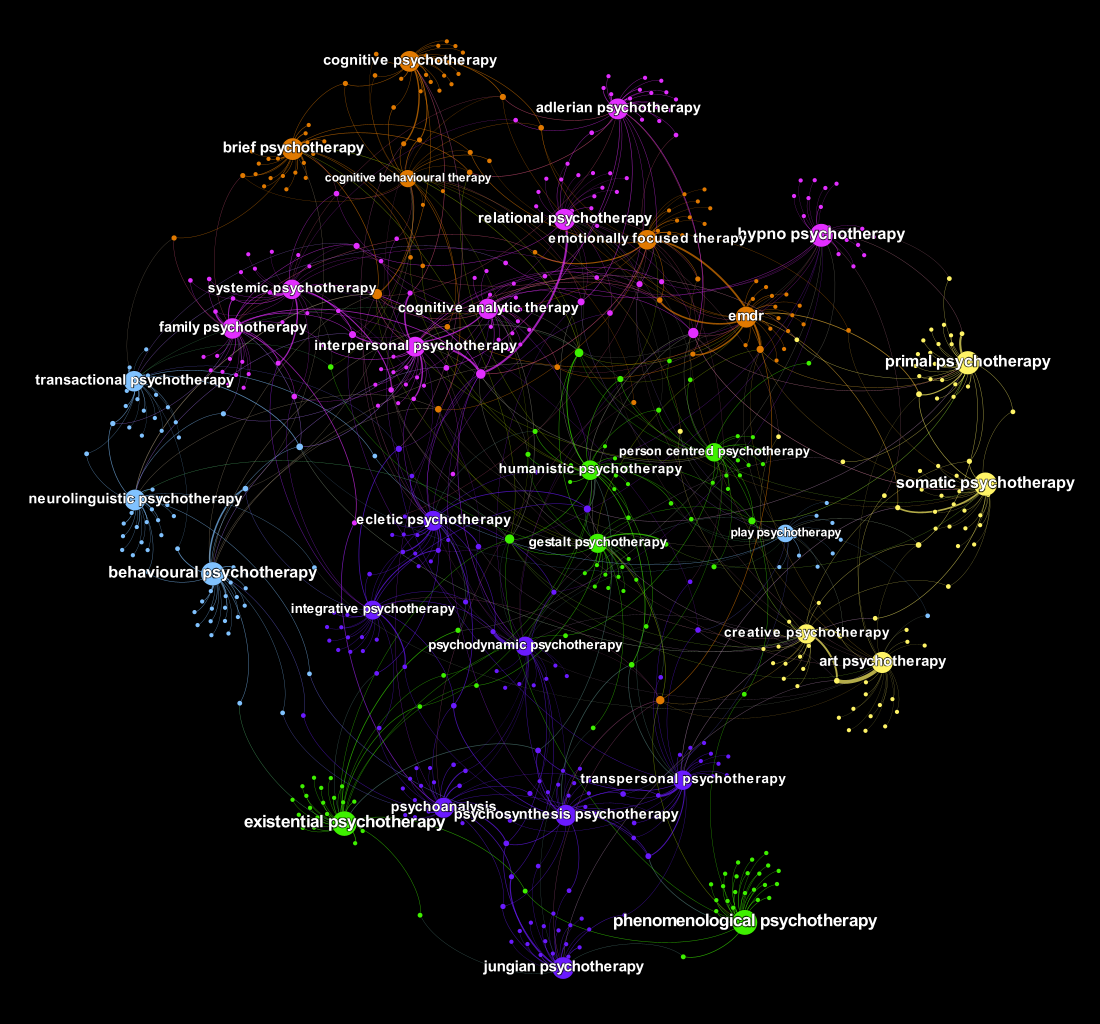
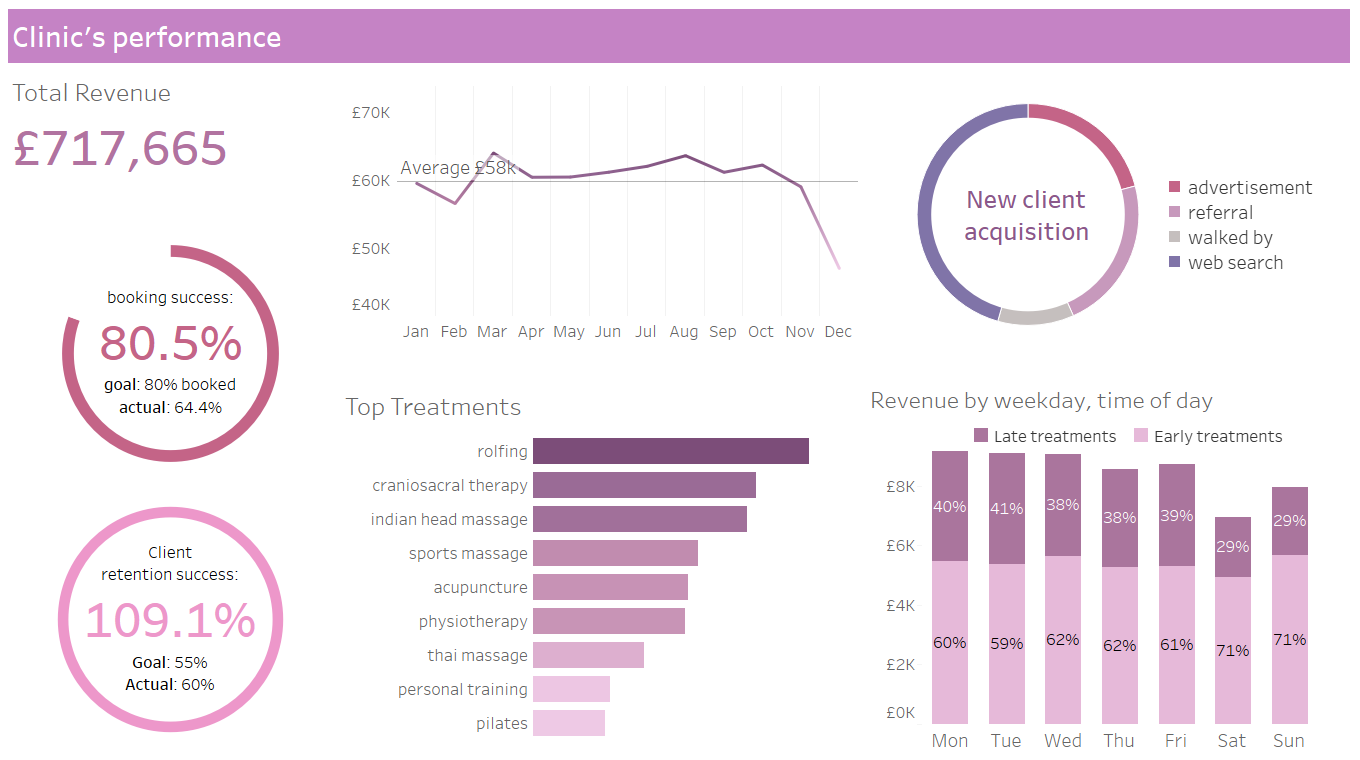
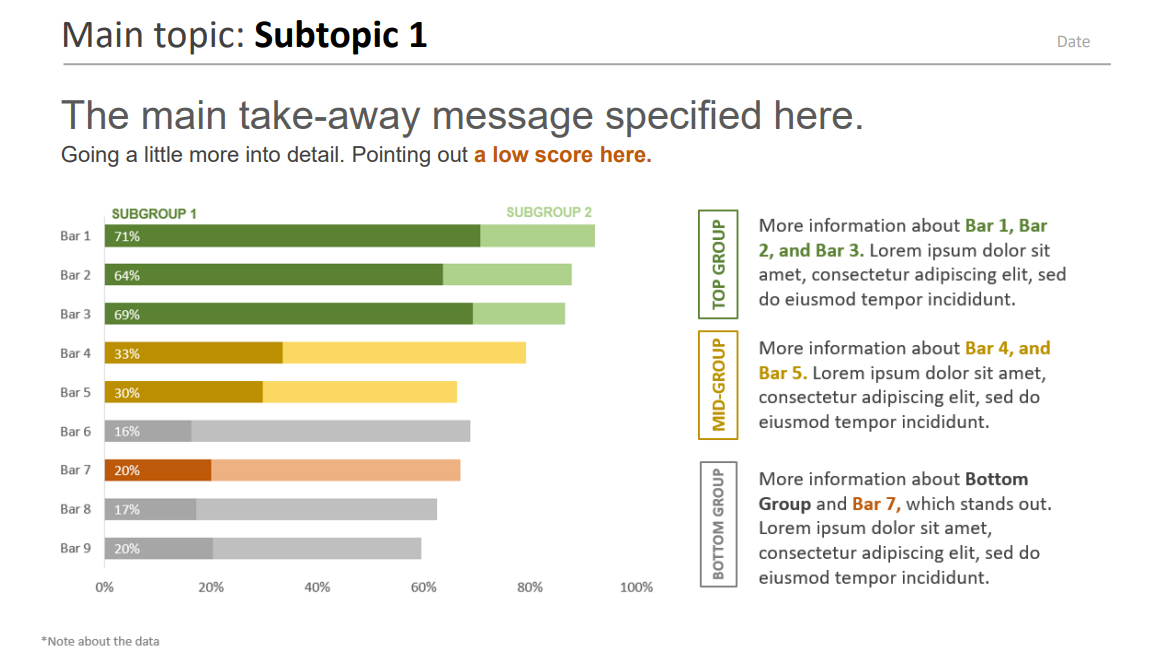
An example of a real (anonymised and data-stripped) analysis report where I visualised and outlined the key takeaway points. The reader is guided through a structured narrative: introduction of the key findings, contributing factors, potential solution, and summary with a call to action.

Take a look!

The Main Types of Psychotherapy

Python | NLP | Web Scraping | Infographic

In this project I tackle a problem that has bugged me for a while: the difficulty to be informed about different types of psychotherapy available. I use Python and NLP to simplify and organise a large volume of non-standardised information available online to aid in informed decision making.

Take a look!

Psychotherapy Network

Python | Gephi | Data Visualisation

This visualisation is a part of 'Types of Psychotherapy' project that deserves its own spotlight. It shows how different types of psychotherapy are connected and clustered togehter through shared concepts and ideas, represented by commonly used words in their descriptions.

Best explored using a computer.

Take a look!

Psychotherapy: combining approaches

Python | amCharts | Data Visualisation

Another visualisation that is part of a larger 'Types of Psychotherapy' project. Visualised here is the "integrative" aspect of psychotherapy - the evergrowing tendency of therapists to offer mulitple types of therapies in conjunction for best results.

Best explored using a computer.

Take a look!

Dashboard Building

SQL | Python | Tableau | Database Design | Dashboards

In this project I generate a mock clinic's data, design a relational database to store it, query the database for KPIs with SQL and create dashboards to track performance for the clinic and its employees.

Take a look!